Topic: Adding 95th percentile graphing to Munin graphs
Date: 2017 OCT 19
I use Munin for monitoring several critical aspects of VMs, applications running in VMs, and the hypervisors themselves. Having historical time-series data helps in planning for hardware upgrades/expansion, gives warning before disks fill up, and helps target which parts of a complex application are causing the most end-user slowdown pain. Bandwidth utilization is monitored on every single VM, since my colocation ISP bills based on usage.
This particular ISP bills on 95th percentile usage, meaning that the top 5% of traffic over a given period is ignored when calculating bandwidth utilization. This allows for large spikes in bandwidth utilization on a lower tier of service, without having to restrict the overall connection to the typical tier of service used. For example, one of my smaller VMs is on a 1 Mbit/s 95th percentile service, but can spike up to the actual interface cap on the ISPs router. Thus, events that require a large amount of bandwidth, like nightly backups, can saturate the connection without forcing the VM into a higher tier of service.
Out of the box, Munin does not chart 95th percentile usage. This support ticket requested the feature in 2006. A not-so-great patch was provided as an answer. Since then, Robin Johnson (robbat2) wrote this writeup on adding 95th percentile data to existing graphs using graph_args_after which allows for modifying graphs through configuration rather than source code change. This is the guide I followed; however, figuring out where to put the code and how to use it is an exercise left to the reader!
Here’s a snippet from /etc/munin/munin.conf on one of my VMs that graphs 95th percentile bandwidth usage:
[testnode.example.com]
    address [2001:DB8::1]
    use_node_name yes
    if_eth0.graph_args_after \
        VDEF:totalpercdown=gcdefdown,95,PERCENT \
        VDEF:ntotalpercdown=ngcdefdown,95,PERCENT \
        VDEF:totalpercup=gcdefup,95,PERCENT \
        COMMENT:\ \\n \
        LINE1:totalpercup\#CC0000:95th\ Percentile\ Up\\: \
        GPRINT:totalpercup:\ \ \%6.2lf\%s\\n \
        LINE1:ntotalpercdown\#0000CC:95th\ Percentile\ Down\\: \
        GPRINT:totalpercdown:\%6.2lf\%s\\n
As seen above, graph_args_after is called on the name of an existing graph inside a particular node’s definition. In this case, we’re using graph_args_after on if_eth0 which is the standard interface statistics graph that comes with Munin. Any options that can be passed to rrdtool graph can be passed using this method. Whitespace and special characters must be escaped, and escaping rules for rrdtool graph need to be followed, too.
VDEF lines define a calculated variable. The format is VDEF:newvar=oldvar,op1,op2,...opN where op1,op2,...opN are operations that rrdtool support in RPN format – for example, the first VDEF calculates the 95th percentile value of gcdefdown (a variable previously assigned in the if_ Munin plugin that counts interface bits coming into the interface).
The COMMENT line simply inserts a space followed by a newline; this is one way to add vertical space to a graph’s legend. Note that both the space and the backslash for the newline must be escaped!
LINE1 defines a horizontal line to be plotted across the entire width of the graph. The 1 in LINE1 indicates that the line will be plotted as a single pixel width line. The second part of the statement defines the variable to be plotted (totalpercup in the first LINE1 above), followed by the RGB color value. The third part is the legend label. Note that the colon must be double-escaped!
GPRINT will print a formatted string to the graph. Here, the GRPINT follows each LINE1 so that the value will be next to the legend in the final graph. The second part is the variable to print, and the third part is a format string for how to print the variable. The conventions are covered in the rrdtool documentation. Note the escaped spaces to align the value for totalpercup. Adding an escaped newline character to the GPRINT statements causes the legend swatches to be printed one below the other.
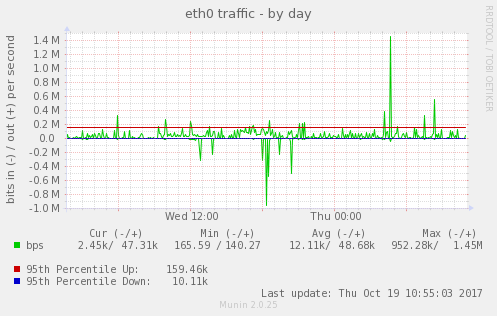
Finally, here’s a sample graph produced with Munin 2.0.25 and the above configuration:

bandwidth overcharges avoided